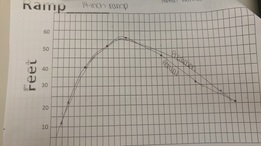
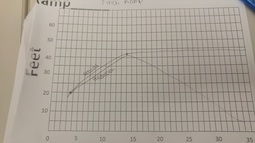
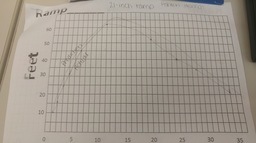
My prediction for my first two graphs were pretty close, the only one that was different was my last graph, the 7-inch ramp. My prediction was wrong because I assumed that like the other two it would end up going backward. But, because it was only a 7-inch ramp, it didn't have as much momentum as the only two ramps so it didn't go backwards. The zeros of the graphs represent where the skateboard started and stopped. All the graphs had maximums and minimums but they didn't all have zeros. The graphs rise fastest in the beginning right after they come off the ramp because that's when they have the most momentum and are going the fastest.
 RSS Feed
